Summary
Below you'll find the results for all performance measures recorded for all UQ players that were filmed in Season 2009. Only data from players that actually completed enough on-field time during the filmed matches are provided. Players have not been identified, so if you think you may have been included in the list of players then and he'll send you your own individual player code so that you can identify your individual results.
Below the tables you'll find an explanation of the variables presented.
Results: Firsts
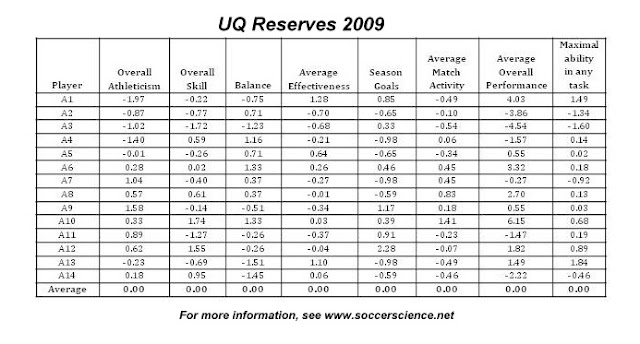
Results: Reserves
How to interpret the tables:
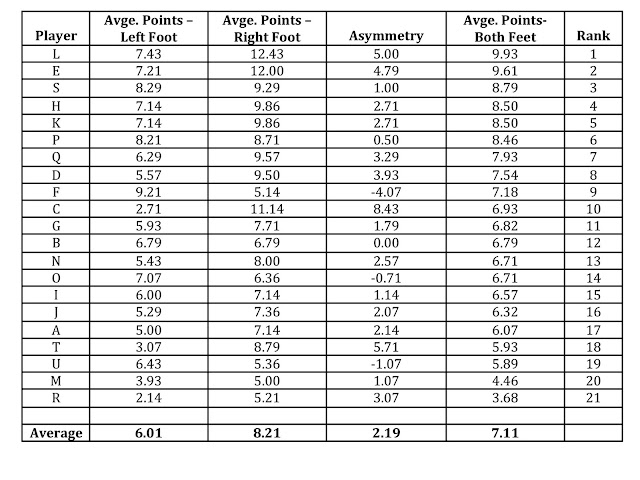
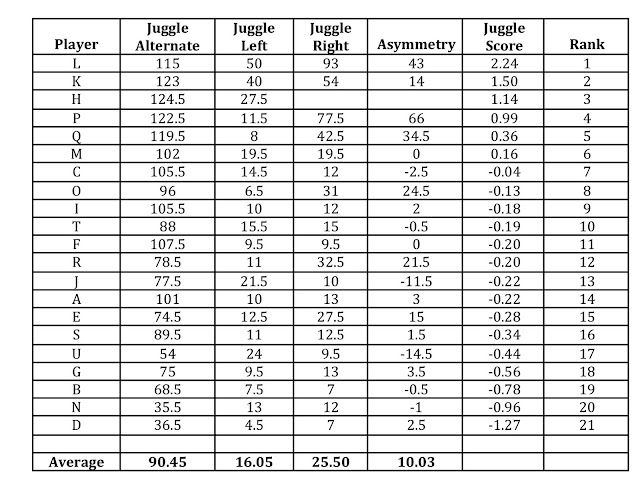
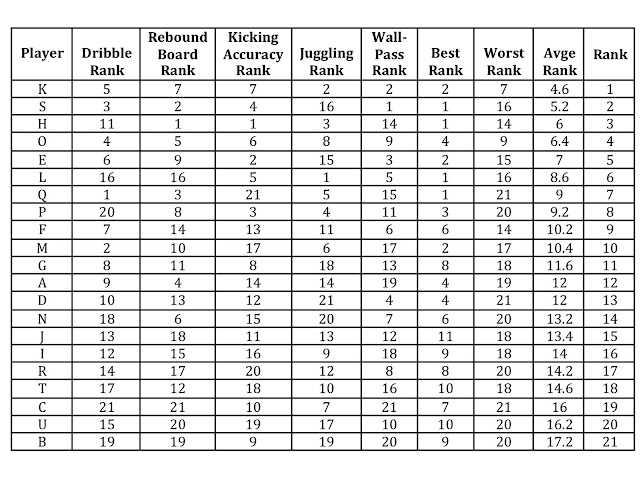
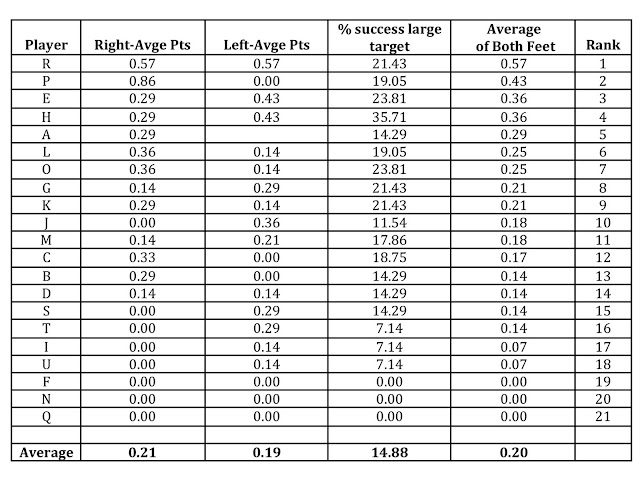
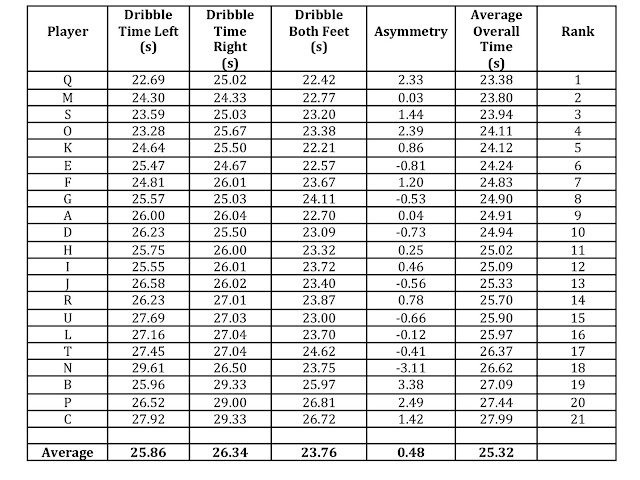
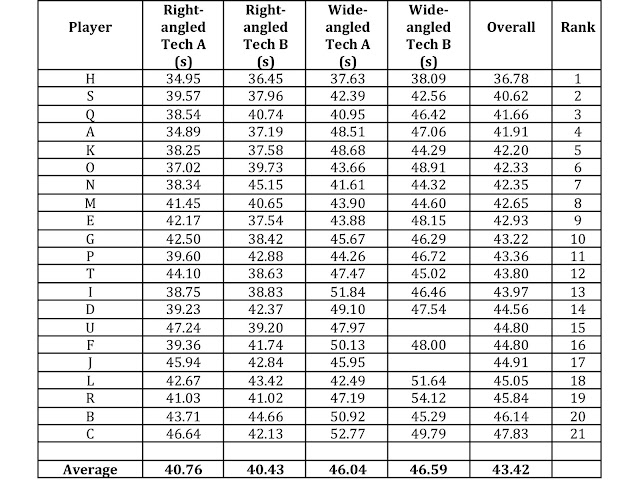
For each variable, the data have been standardised to an average of zero. This means that those that performed well in a given task scored in the positive direction while those that were below average had negative scores. It's easy to see the ranks for each player in each drill by scanning the list.
Performance Variables:
Player: Each individual player’s unique player identification code.
Overall Athleticism: This is a composite measure of an individual’s overall performance across the 16 different athletic tests measured. These included sprint speed, endurance, power, agility, and lower and upper-body power and endurance.
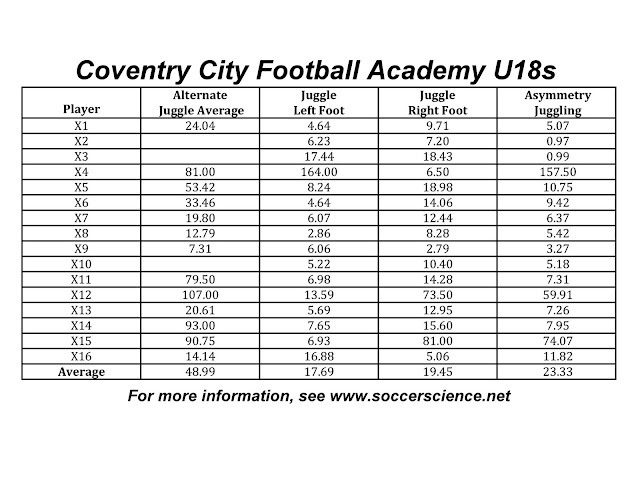
Overall Skill: This is a composite measure of an individual’s overall performance across all 5 skill tests, including passing accuracy, volley accuracy, heading accuracy, dribbling speed and juggling ability.
Balance: An overall measure of static balance.
Average Effectiveness: This is a measure of an individual’s average ability to successfully complete any task that they are involved in during a match. For example, this will take into consideration the overall number of passes that were successful (i.e. % success).
Season Goals: Overall number of goals scored during season 2009.
Average Match Activity: This is a measure of how often an individual is involved in activities involving the ball. This will include the number of tackles, touches, passes, shots, crosses etc. Anything that involves the ball.
Overall Match Performance: This is a measure of an individual’s average involvement and effectiveness across all tasks in a game.
Maximal Ability in any one task: This is the highest score achieved by an individual across any of the tasks measured. This can include any of the performance measures recorded, including passes, shots, goals, tackles, interception etc.
If you have any questions about how to interpret these results, contact Robbie at .